Air Conditioning (A/C) System Performance Test L61, LE5
| Table 1: | A/C Performance Table |
This test measures the operating efficiency of the A/C system under the following conditions:
| • | The current ambient air temperature |
| • | The current relative humidity |
| • | The high side pressure of the A/C system |
| • | The low side pressure of the A/C system |
| • | The temperature of the air being discharged into the passenger compartment |
Test Description
The numbers below refer to the step numbers on the diagnostic table.
-
This step determines if the A/C system has at least the minimum refrigerant charge required to operate the system without damage.
-
This step measures the performance of the A/C system.
-
This step is to allow for vehicle variations as well as high ambient temperatures.
Step | Action | Values | Yes | No | ||||||||||||||||||||||||||
|---|---|---|---|---|---|---|---|---|---|---|---|---|---|---|---|---|---|---|---|---|---|---|---|---|---|---|---|---|---|---|
|
Important:
| ||||||||||||||||||||||||||||||
Are both the low side and high side pressures within the specified value? | More than 16°C (60°F) - 345 kPa (50 psi) More than 24°C (75°F) - 483 kPa (70 psi) More than 33°C (90°F) - 690 kPa (100 psi) | Go to Step 2 | Go to Leak Testing | |||||||||||||||||||||||||||
Important: Record the relative humidity and the ambient air temperature at the time of the test.
Important: Press the RESET button, before using the print function of the J 43600 .
Does all the data recorded fall within the specified ranges of the A/C Performance Table below? | -- | Go to Step 8 | Go to Step 3 | |||||||||||||||||||||||||||
If the pressures and temperatures recorded do not fall within the specified ranges:
Does all the data recorded fall within the specified ranges of the table below? | -- | Go to Step 8 | Go to Step 4 | |||||||||||||||||||||||||||
4 | Do the high and low side pressures fall within the specified ranges, but the panel outlet temperatures do not? | -- | Go to Step 5 | |||||||||||||||||||||||||||
5 | Is the low side pressure greater than the specified range, but the high side pressure within or less than the specified range? | -- | Go to Step 6 | |||||||||||||||||||||||||||
6 | Are the low and high side pressures both greater than the specified ranges? | -- | Go to Step 7 | |||||||||||||||||||||||||||
7 | Is the high side pressure greater than the specified range, but the low side pressure is within or less than the specified range? | -- | Go to Step 8 | |||||||||||||||||||||||||||
8 | Operate the system in order to verify the test results. Did you find the same results? | -- | System OK | |||||||||||||||||||||||||||
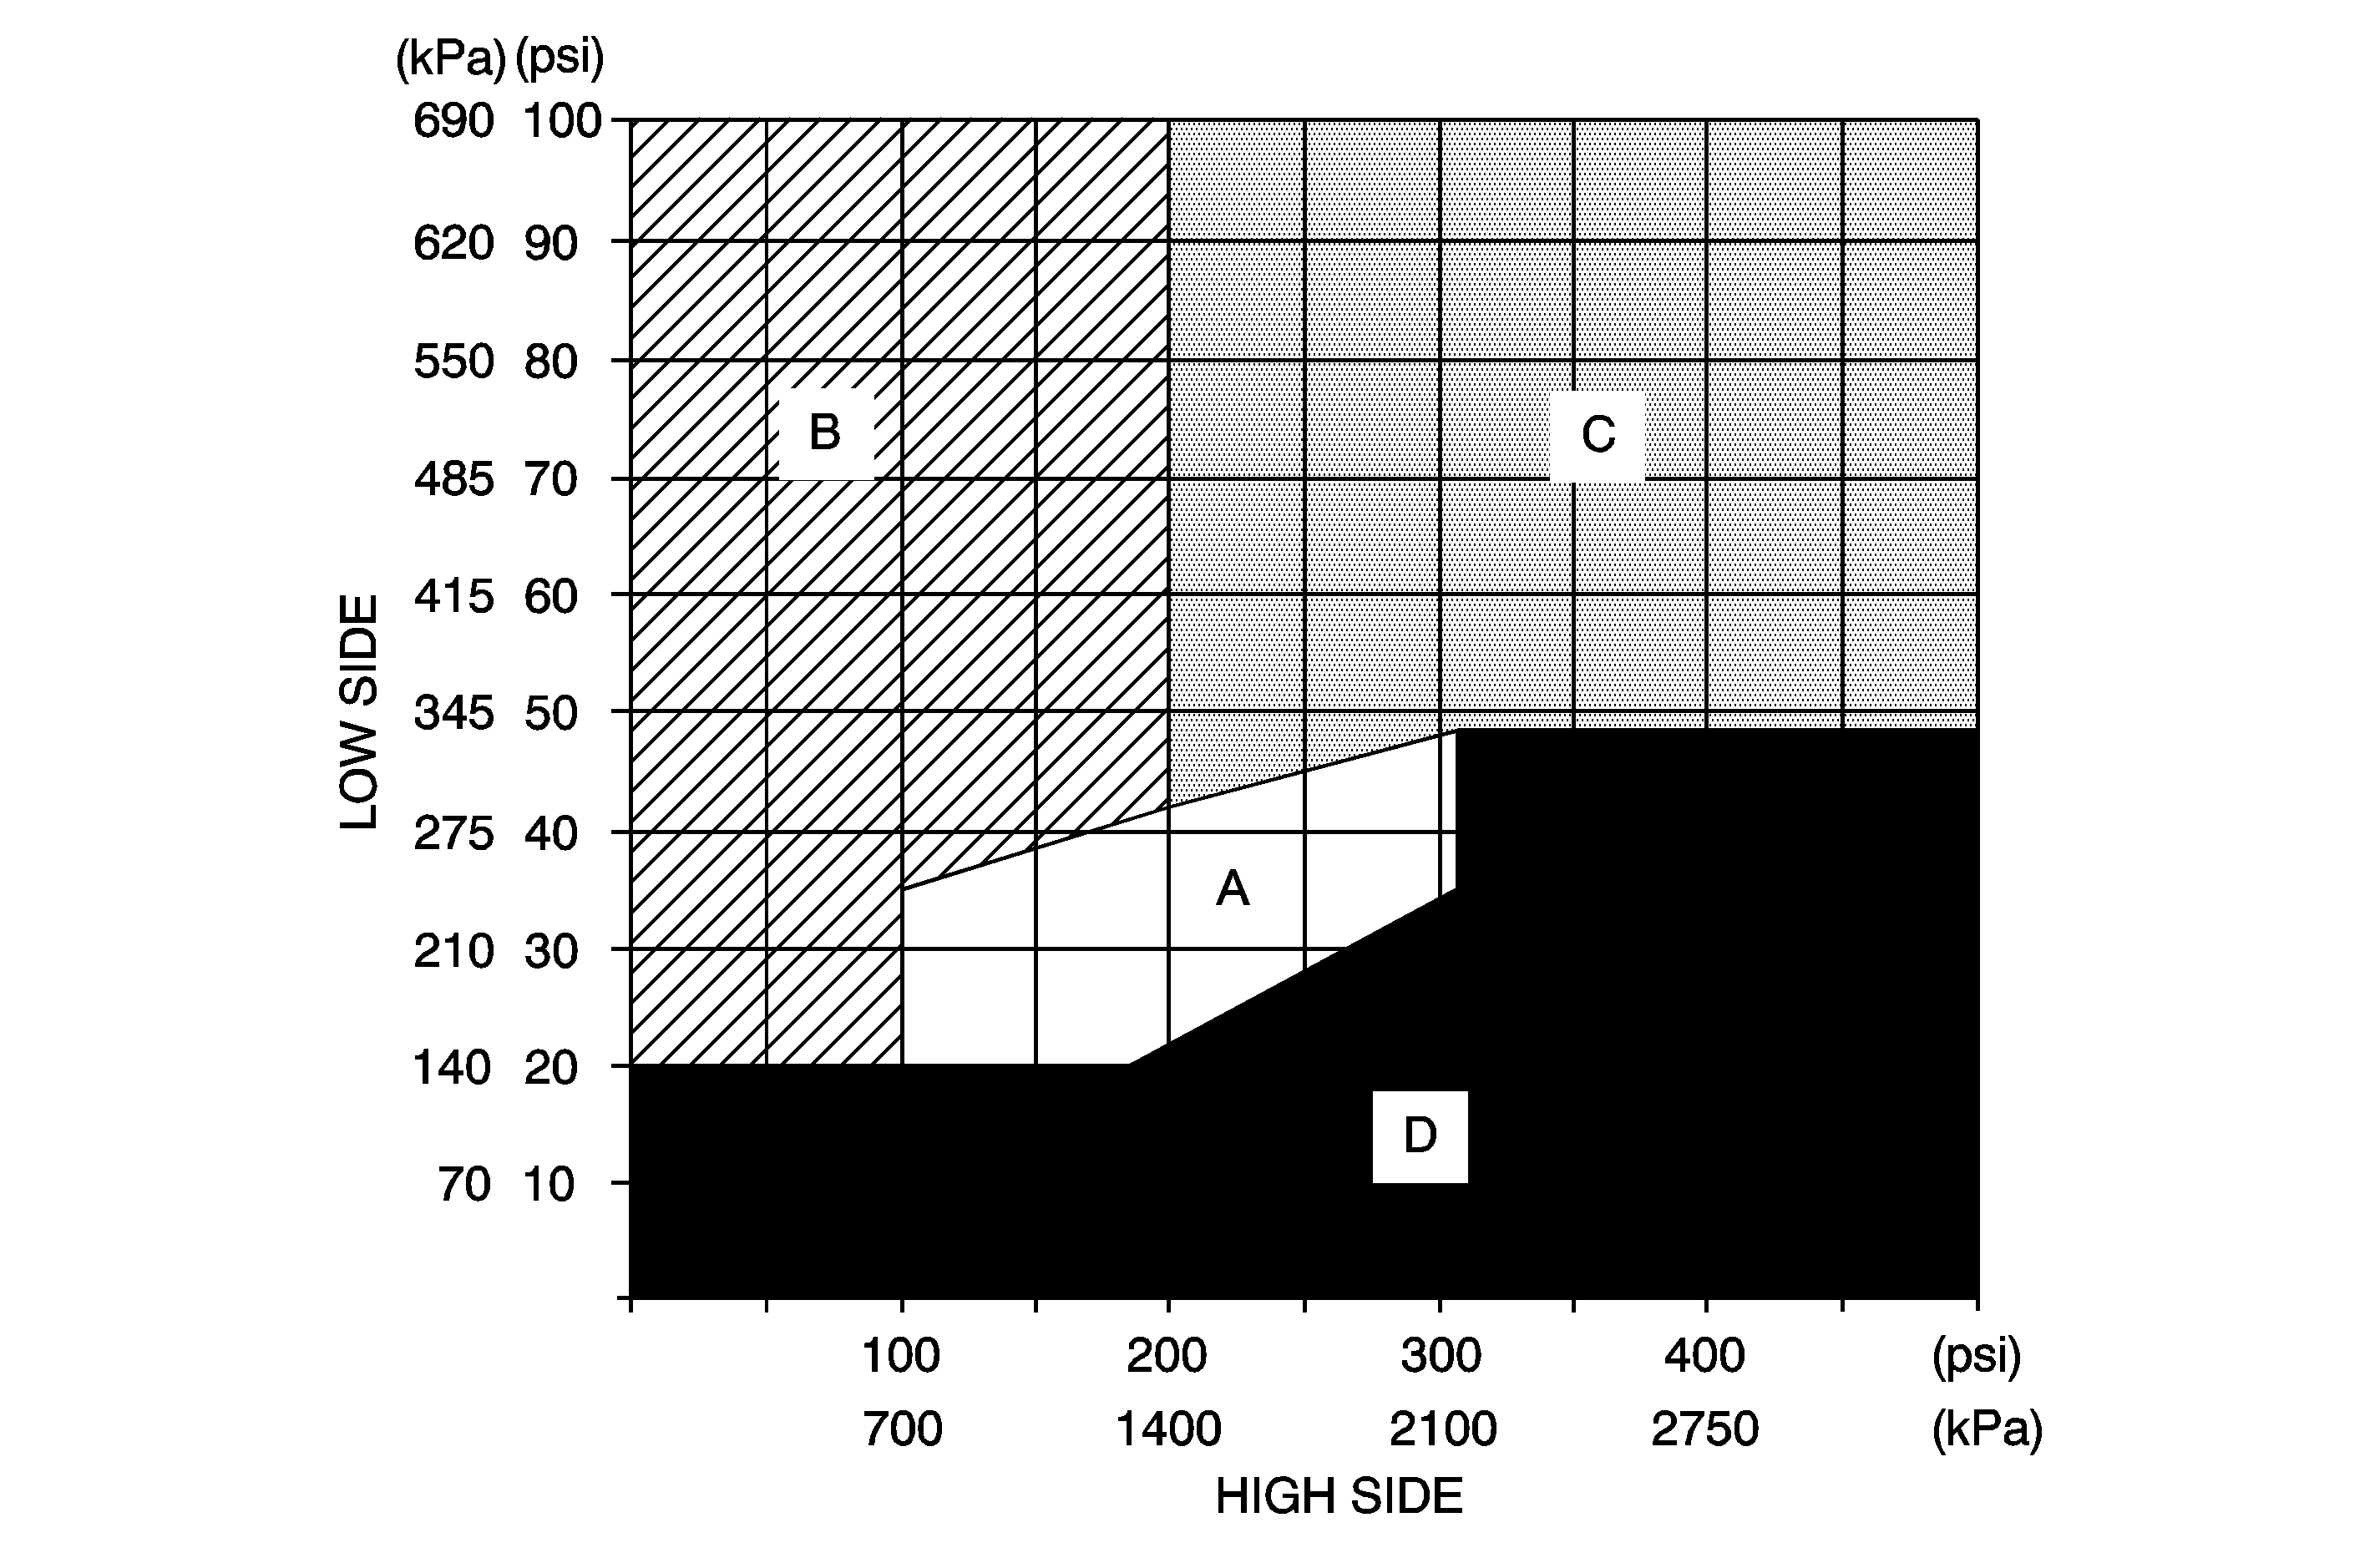
A/C System Pressure-Zone Classification Graph

Ambient Temperature | Relative Humidity | Low Side Service Port Pressure | High Side Service Port Pressure | Maximum Left Center Discharge Air Temperature |
|---|---|---|---|---|
13-18°C (55-65°F) | 0-100% | 158-227 kPa (23-33 psi) | 578-1012 kPa (84-147 psi) | 8°C (46°F) |
19-24°C (66-75°F) | Below 40% | 151-220 kPa (22-32 psi) | 716-1157 kPa (104-168 psi) | 8°C (46°F) |
Above 40% | 172-241 kPa (25-35 psi) | 813-1302 kPa(118-189 psi) | 10°C (50°F) | |
25-29°C (76-85°F) | Below 35% | 172-234 kPa (25-34 psi) | 999-1371 kPa (145-199 psi) | 10°C (50°F) |
35-50% | 179-241 kPa (26-35 psi) | 1067-1433 kPa(155-208 psi) | 10°C (50°F) | |
Above 50% | 186-248 kPa (27-36 psi) | 1123-1543 kPa(163-224 psi) | 12°C (52°F) | |
30-35°C (86-95°F) | Below 30% | 186-248 kPa (27-36 psi) | 1219-1619 kPa (177-235 psi) | 13°C (55°F) |
30-50% | 192-248 kPa (28-36 psi) | 1267-1708 kPa(184-248 psi) | 13°C (55°F) | |
Above 50% | 199-254 kPa (29-37 psi) | 1350-1832 kPa (196-266 psi) | 13°C (55°F) | |
36-41°C (96-105°F) | Below 20% | 199-261 kPa (29-38 psi) | 1460-1853 kPa (212-269 psi) | 13°C (55°F) |
20-40% | 206-261 kPa (30-38 psi) | 1502-1942 kPa (218-282 psi) | 14°C (57°F) | |
Above 40% | 206-261 kPa (30-38 psi) | 1577-2032 kPa( 229-295 psi) | 15°C (59°F) | |
42-46°C (106-115°F) | Below 20% | 220-275 kPa (32-40 psi) | 1722-2067 kPa (250-300 psi) | 15°C (59°F) |
Above 20% | 220-275 kPa (32-40 psi) | 1770-2170 kPa(257-315 psi) | 17°C (61°F) | |
47-49°C (116-120°F) | Below 30% | 234-303 kPa (34-44 psi) | 1991-2342 kPa (289-340 psi) | 19°C (65°F) |
Air Conditioning (A/C) System Performance Test RPO LSJ
| Table 1: | A/C Performance Table |
This test measures the operating efficiency of the A/C system under the following conditions:
| • | The current ambient air temperature |
| • | The current relative humidity |
| • | The high side pressure of the A/C system |
| • | The low side pressure of the A/C system |
| • | The temperature of the air being discharged into the passenger compartment |
Test Description
The numbers below refer to the step numbers on the diagnostic table.
-
This step determines if the A/C system has at least the minimum refrigerant charge required to operate the system without damage.
-
This step measures the performance of the A/C system.
-
This step is to allow for vehicle variations as well as high ambient temperatures.
Step | Action | Values | Yes | No | ||||||||||||||||||||||||||
|---|---|---|---|---|---|---|---|---|---|---|---|---|---|---|---|---|---|---|---|---|---|---|---|---|---|---|---|---|---|---|
|
Important:
| ||||||||||||||||||||||||||||||
Are both the low side and high side pressures within the specified value? | More than 16°C (60°F) - 345 kPa (50 psi) More than 24°C (75°F) - 483 kPa (70 psi) More than 33°C (90°F) - 690 kPa (100 psi) | Go to Step 2 | Go to Leak Testing | |||||||||||||||||||||||||||
Important: Record the relative humidity and the ambient air temperature at the time of the test.
Important: Press the RESET button, before using the print function of the J 43600 .
Does all the data recorded fall within the specified ranges of the A/C Performance Table below? | -- | Go to Step 8 | Go to Step 3 | |||||||||||||||||||||||||||
If the pressures and temperatures recorded do not fall within the specified ranges:
Does all the data recorded fall within the specified ranges of the table below? | -- | Go to Step 8 | Go to Step 4 | |||||||||||||||||||||||||||
4 | Do the high and low side pressures fall within the specified ranges, but the panel outlet temperatures do not? | -- | Go to Step 5 | |||||||||||||||||||||||||||
5 | Is the low side pressure greater than the specified range, but the high side pressure within or less than the specified range? | -- | Go to Step 6 | |||||||||||||||||||||||||||
6 | Are the low and high side pressures both greater than the specified ranges? | -- | Go to Step 7 | |||||||||||||||||||||||||||
7 | Is the high side pressure greater than the specified range, but the low side pressure is within or less than the specified range? | -- | Go to Step 8 | |||||||||||||||||||||||||||
8 | Operate the system in order to verify the test results. Did you find the same results? | -- | System OK | |||||||||||||||||||||||||||
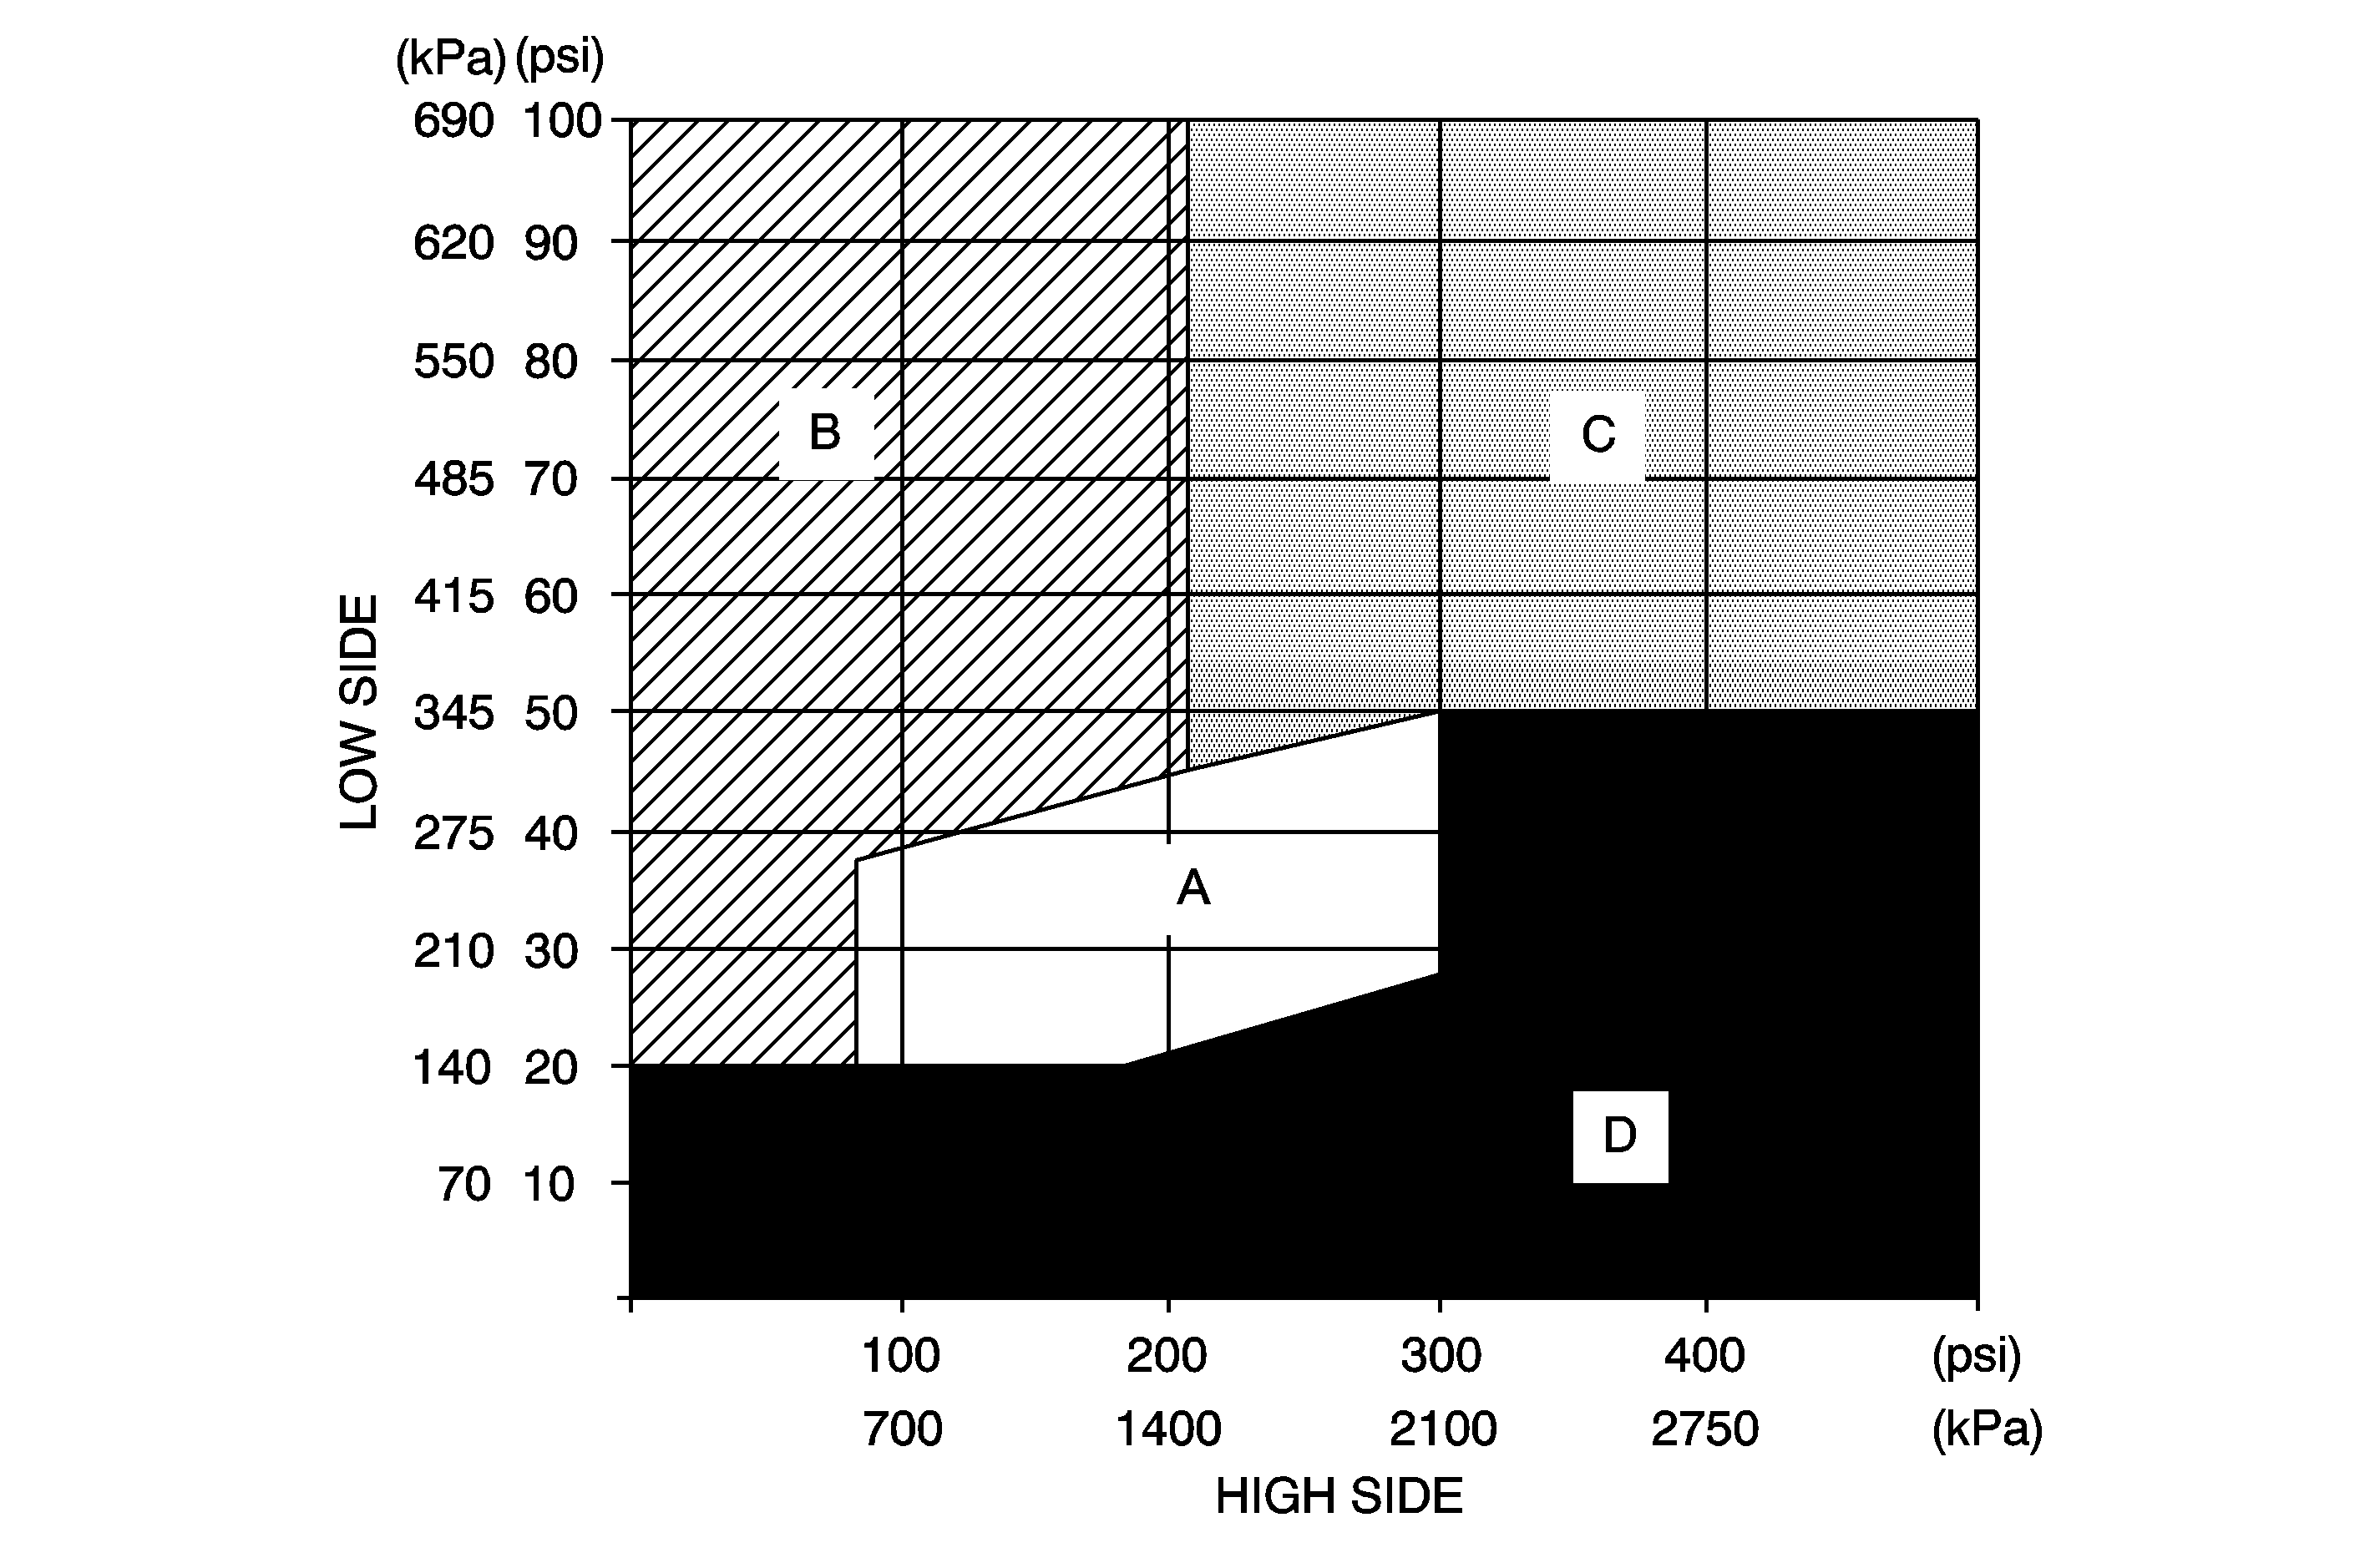
A/C System Pressure-Zone Classification Graph

Ambient Temperature | Relative Humidity | Low Side Service Port Pressure | High Side Service Port Pressure | Maximum Left Center Discharge Air Temperature |
|---|---|---|---|---|
13-18°C (55-65°F) | 0-100% | 158-234 kPa (23-343 psi) | 640-992 kPa (93-144 psi) | 10°C (50°F) |
19-24°C (66-75°F) | Below 40% | 151-220 kPa (22-32 psi) | 702-1274 kPa (102-185 psi) | 10°C (50°F) |
Above 40% | 172-241 kPa (25-35 psi) | 792-1129 kPa (115-164 psi) | 10°C (50°F) | |
25-29°C (76-85°F) | Below 35% | 172-234 kPa (25-34 psi) | 909-1446 kPa (132-210 psi) | 10°C (50°F) |
35-50% | 179-241 kPa (26-35 psi) | 9577-1212 kPa (139-176 psi) | 10°C (50°F) | |
Above 50% | 186-248 kPa (27-36 psi) | 992-1322 kPa (144-192 psi) | 12°C (52°F) | |
30-35°C (86-95°F) | Below 30% | 186-241 kPa (27-35 psi) | 1081-1371 kPa (157-199 psi) | 13°C (55°F) |
30-50% | 186-248 kPa (27-36 psi) | 11027-1378 kPa (160-200 psi) | 13°C (55°F) | |
Above 50% | 186-248 kPa (27-36 psi) | 1129-1398 kPa (164-203 psi) | 14°C (57°F) | |
36-41°C (96-105°F) | Below 20% | 186-254 kPa (27-37 psi) | 1267-1550 kPa (184-225 psi) | 13°C (55°F) |
20-40% | 199-261 kPa (29-38 psi) | 1281-1550 kPa (186-225 psi) | 14°C (57°F) | |
Above 40% | 220-289 kPa (32-42 psi) | 1288-1715 kPa (187-249 psi) | 15°C (62°F) | |
42-46°C (106-115°F) | Below 20% | 213-268 kPa (31-39 psi) | 1467-1722 kPa (213-250 psi) | 15°C (59°F) |
Above 20% | 213-275 kPa (31-40 psi) | 1467-1818 kPa (213-264 psi) | 16°C (60°F) | |
47-49°C (116-120°F) | Below 30% | 234-303 kPa (34-44 psi) | 1639-1977 kPa (238-287 psi) | 19°C (65°F) |
