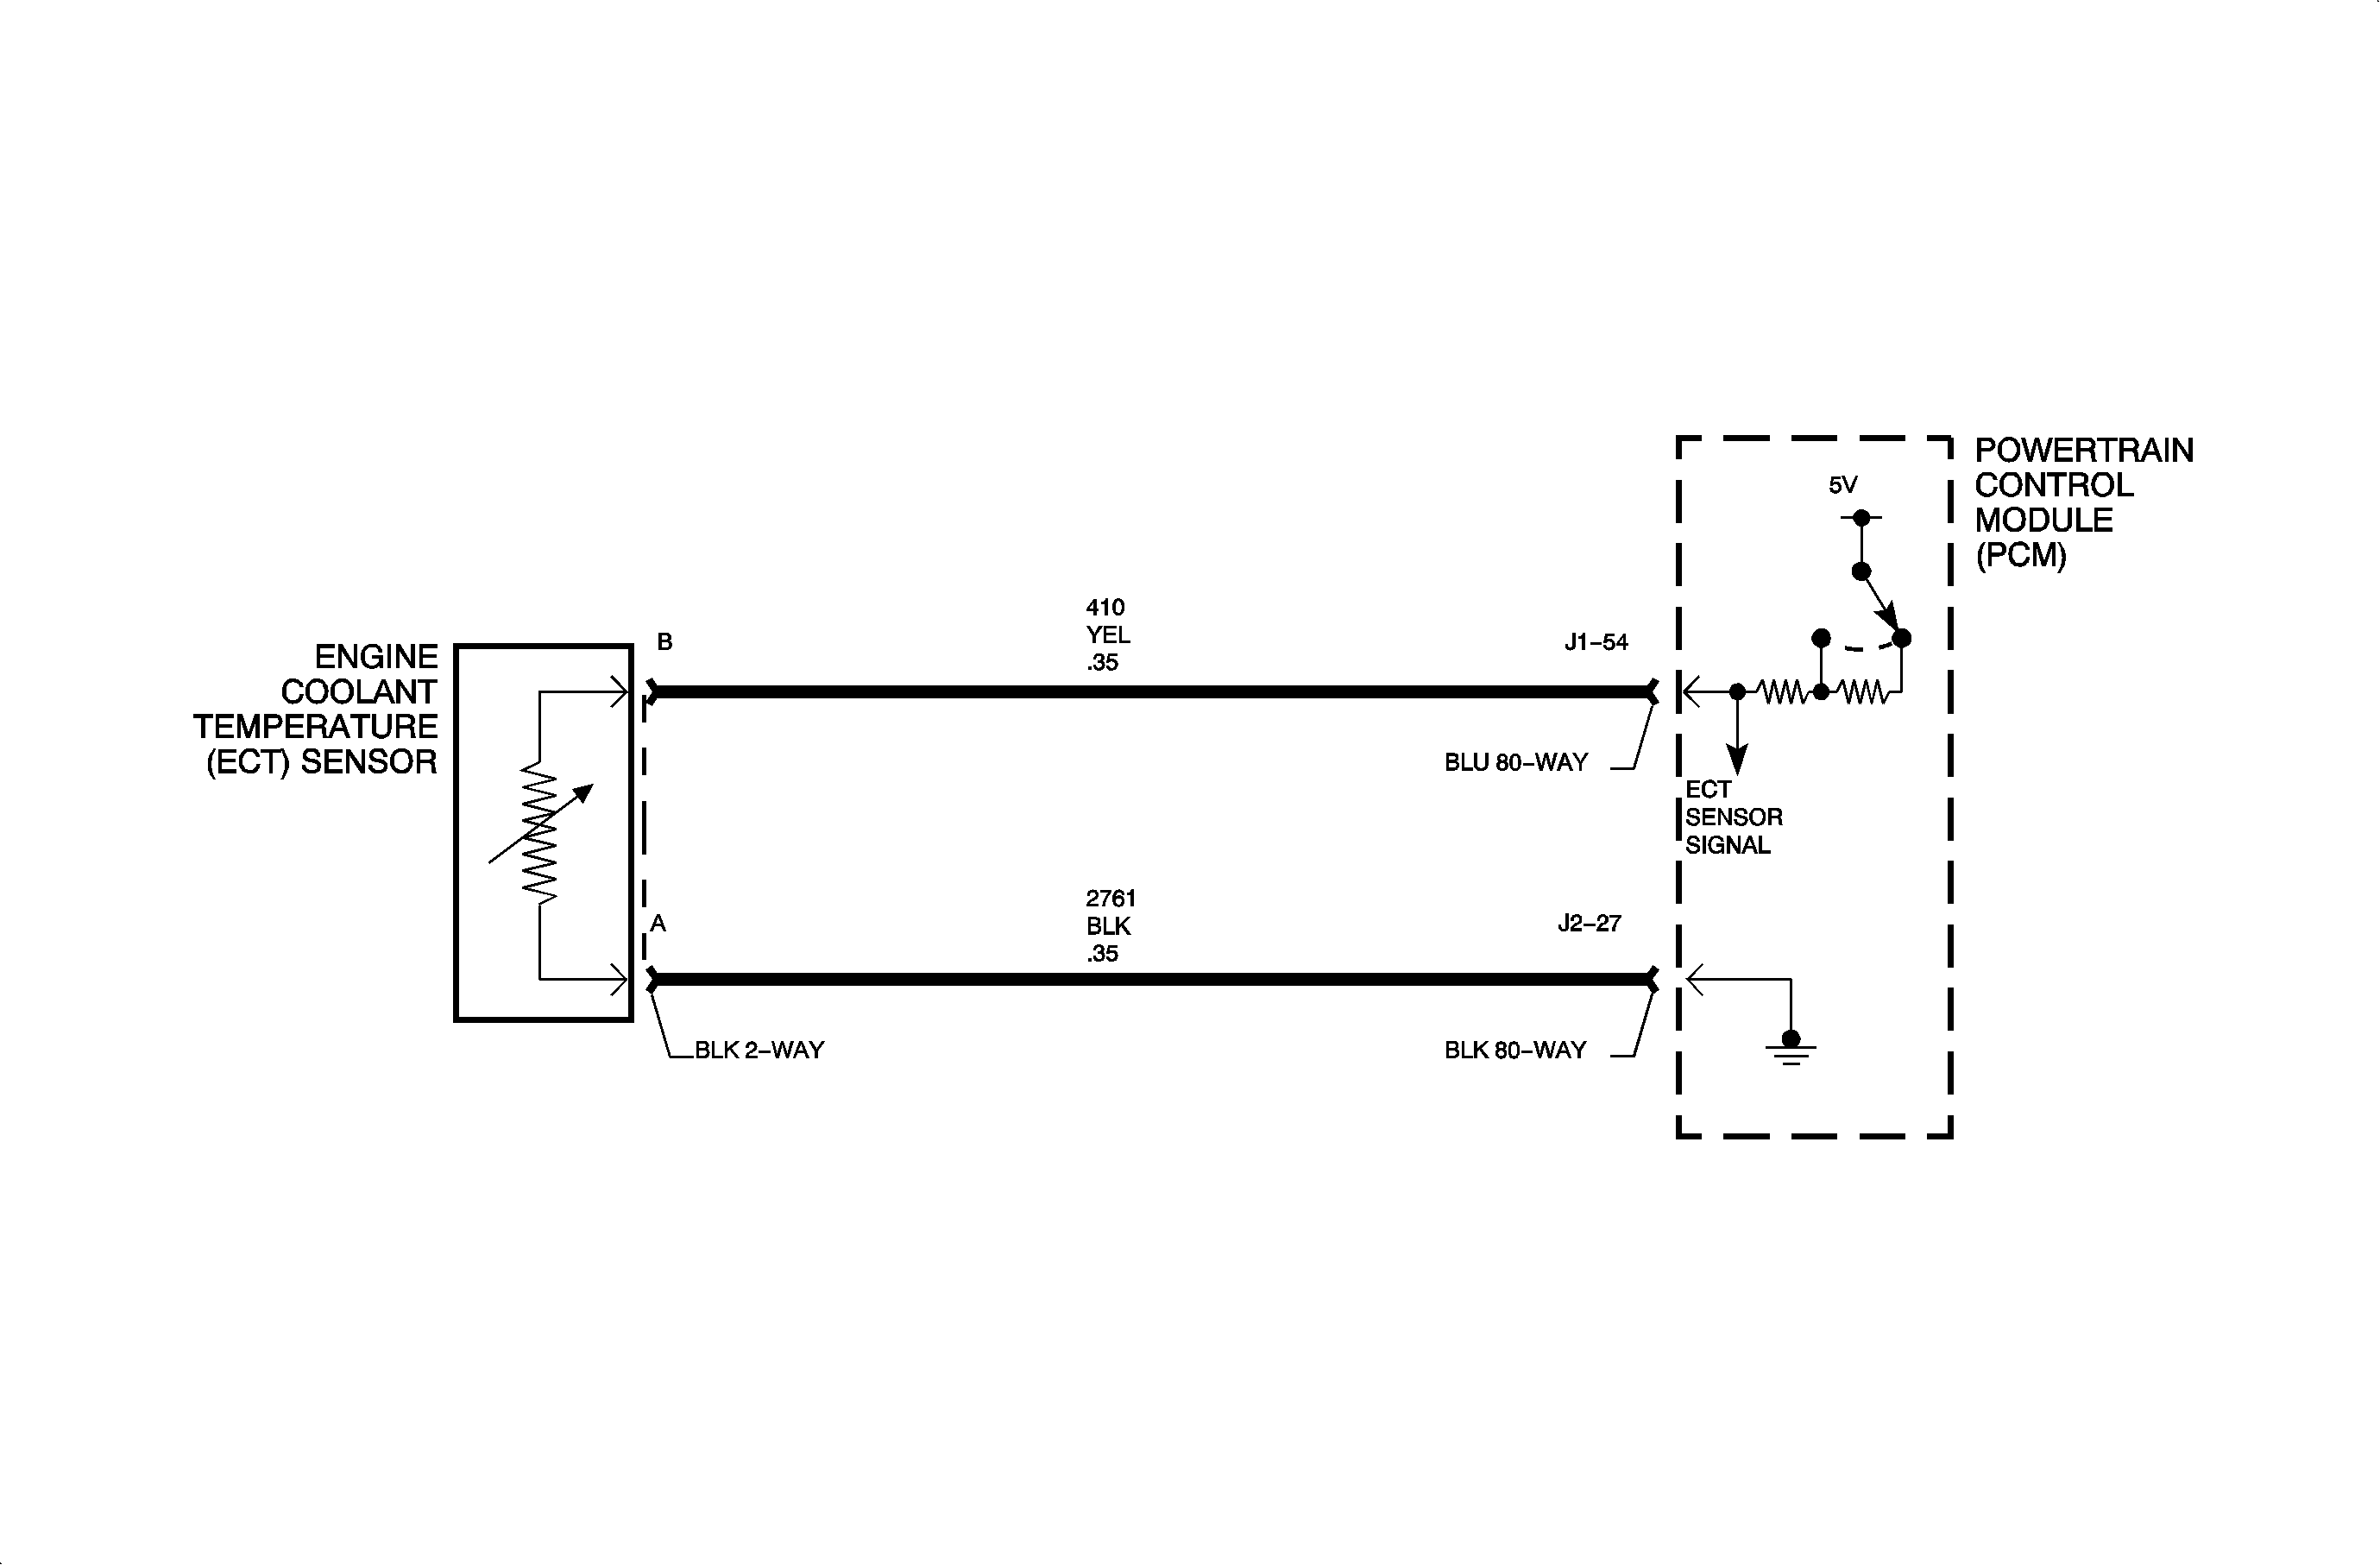
The engine coolant temperature (ECT) sensor is a thermistor that varies resistance
according to changes in engine coolant temperature. The PCM supplies a 5 volt
reference through a pull-up resistor to the sensor, which is connected to ground.
When the sensor is cold, it has a high resistance, high signal voltage at the PCM.
As the sensor temperature increases, its resistance decreases, lower signal voltage
at the PCM. The PCM uses the signal voltage to determine engine coolant temperature.
DTC P0125 sets when the calculated accumulated airflow exceeds the predicted
accumulated airflow when the engine coolant temperature has reached a calibrated temperature.
More air will flow through a cold engine then when the engine is warm.
Conditions for Setting the DTC
DTC P0125 will set if the calculated accumulated airflow has been exceeded,
based on predicted airflow, when the ECT sensor temperature has reached 40°C (104°F)
when:
| • | The vehicle has traveled greater than 0.8 km (0.5 miles)
when vehicle speed is above 40 km/h (25 mph). |
| • | Calculated average air flow is greater than 20 grams/second. |
| • | Engine run time is between 30 seconds and 30 minutes. |
| • | Startup ECT is less than 35°C (95°F). |
| • | IAT is greater than -7°C (19°F). |
| • | No CKP, ECT, EVAP leak, fan control, fuel injector, fuel tank pressure,
fuel trim, IAT, knock, MAP, misfire, O2S-1, TP, vehicle speed, P0420, P0446, or P1441
DTCs have been set. |
DTC P0125 runs once per ignition cycle once the above conditions have been met.
DTC P0125 is a type B DTC.
Diagnostic Aids
DTC P0125 indicates lower than normal engine coolant temperature, which most
likely was NOT caused by a short/open or intermittent short/open in the ECT wiring.
Possible causes of low engine coolant temperature:
| • | Very low ambient temperatures |
| • | Corrosion in connector or resistance in wiring |
Refer to ECT General Description for a Temperature vs. Resistance chart.

